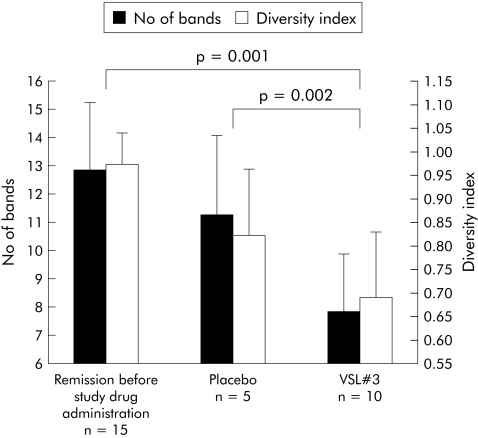
Figure 8 Fungal diversity, indicated as richness (No of bands) and diversity indices, obtained from denaturing gradient gel electrophoresis profiles of pouchitis patients in remission (before study therapy, after induction with antibiotics), after placebo, and two months after treatment with VSL#3. For each group, the mean (SD) number of bands are shown. Fungal diversity in the VSL#3 group was significantly higher compared with both the starting value in remission (p = 0.001) and placebo (p = 0.002). Weighted diversity scores (SD) showed the same tendency.

An official website of the United States government
Here's how you know
Official websites use .gov
A
.gov website belongs to an official
government organization in the United States.
Secure .gov websites use HTTPS
A lock (
) or https:// means you've safely
connected to the .gov website. Share sensitive
information only on official, secure websites.
