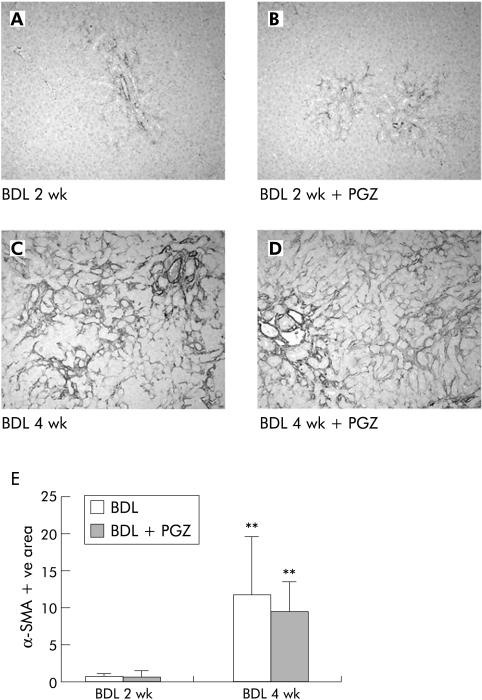
Figure 12 Effects of pioglitazone (PGZ) treatment on the distribution and quantification of α smooth muscle actin (α‐SMA) positive hepatic cells during progression of hepatic fibrosis induced by bile duct ligation (BDL). Representative photomicrographs of α‐SMA immunostained liver sections from rats two weeks (A) or four weeks (B) after BDL, or from rats who received a PGZ supplemented diet from day 5 to day 14 post‐BDL (BDL 2 wk + PGZ) (C) or from day 14 to day 28 post BDL (BDL 4 wk + PGZ) (D). Original magnification 10×. Quantification of hepatic area occupied by α‐SMA positive cells in the different treatment groups (E). Data are expressed as the mean (SD) percentage of α‐SMA positive area related to the total area of the section for n = 4/group. **p<0.01 compared with 2 wk BDL livers similarly treated.

An official website of the United States government
Here's how you know
Official websites use .gov
A
.gov website belongs to an official
government organization in the United States.
Secure .gov websites use HTTPS
A lock (
) or https:// means you've safely
connected to the .gov website. Share sensitive
information only on official, secure websites.
