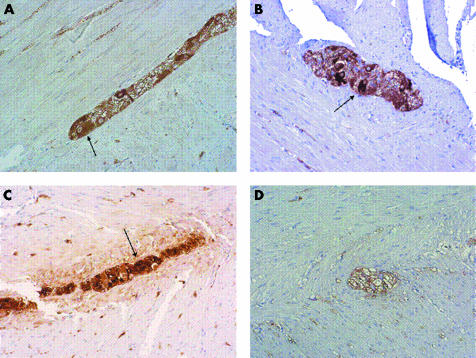
Figure 1 Neurone specific enolase expression in the myenteric plexus in a control subject (A) and in a patient with slow transit constipation (B). The latter showed a decreased number of gangliar cells. Original magnification ×20. Arrows indicate gangliar cells. S100 expression in a control subject (C) and in a patient (D), with the latter showing a reduction in glial cells. Original magnification ×20. Arrow indicates glial cells.

An official website of the United States government
Here's how you know
Official websites use .gov
A
.gov website belongs to an official
government organization in the United States.
Secure .gov websites use HTTPS
A lock (
) or https:// means you've safely
connected to the .gov website. Share sensitive
information only on official, secure websites.
