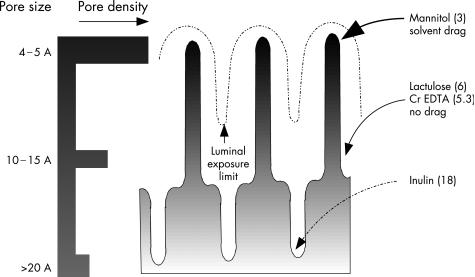
Figure 4 Small intestinal permeation pathways. Depicted is a schematic representation of the crypt‐villus axis. The broken line is an estimated depth of “luminal exposure”—the limit to which solvent drag effects are noticeable. This limit is loosely based on the known distribution of the sodium dependent glucose transporter 1 along this axis. Within this region glucose stimulated water flux is evident and can also drag particles that can fit through the same pathways as water is using. On the left is a qualitative estimate of increasing pore size along the crypt‐villus axis with a horizontal bar providing a qualitative estimate of the number of each sized pore. The location of uptake for the various sized probes is shown on the right with the number in parentheses referring to the hydrodynamic radius of each probe in angstroms.

An official website of the United States government
Here's how you know
Official websites use .gov
A
.gov website belongs to an official
government organization in the United States.
Secure .gov websites use HTTPS
A lock (
) or https:// means you've safely
connected to the .gov website. Share sensitive
information only on official, secure websites.
