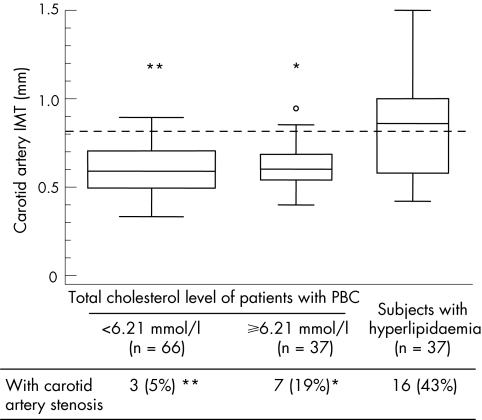
Figure 1 Carotid artery measurements in patients with primary biliary cirrhosis (PBC) and in controls with hypercholesterolaemia.*pc = 0.002; **pc<0.001 for the comparison with subjects with hyperlipidaemia. pc are Bonferroni‐adjusted p values to control for multiple testing. The horizontal dotted line denotes the cut‐off value for the quintile with highest thickness (0.808 mm). Each box extends from the 25th to the 75th centile, an interval referred to as the interquartile range (IQR), and the line in the middle of the box represents the median of the data. The lines emerging from the box extend to the upper and lower adjacent values (the largest data point ⩽75th centile plus 1.5 times the IQR, and the smallest data point ⩾25th centile minus 1.5 times the IQR, respectively). If the examined data come from a normal distribution, we would expect the interval between adjacent values to include 99.3% of the data. Observed points more extreme than the upper or lower adjacent values are plotted individually. Box width has been made proportional to the number of observations. IMT, intima–media thickness.

An official website of the United States government
Here's how you know
Official websites use .gov
A
.gov website belongs to an official
government organization in the United States.
Secure .gov websites use HTTPS
A lock (
) or https:// means you've safely
connected to the .gov website. Share sensitive
information only on official, secure websites.
