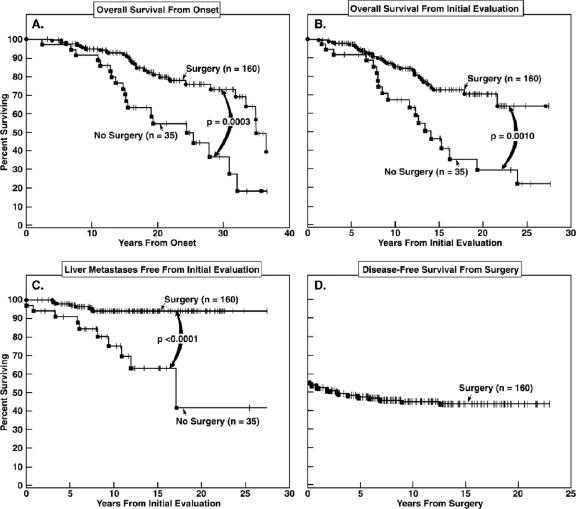
FIGURE 1. Total survival, disease-free survival postresection, and liver metastases-free survival. Total survival from onset of ZES (A) and from the time of the initial ZES evaluation at our institutions (B) is shown for the 160 surgical and 35 nonsurgical patients. Shown in the lower panels is the percent of surgical and nonsurgical patients who remained free of liver metastases with time (C) and the disease-free survival (D) for the surgical group (n = 160) expressed as a percentage of the total surgical group.

An official website of the United States government
Here's how you know
Official websites use .gov
A
.gov website belongs to an official
government organization in the United States.
Secure .gov websites use HTTPS
A lock (
) or https:// means you've safely
connected to the .gov website. Share sensitive
information only on official, secure websites.
