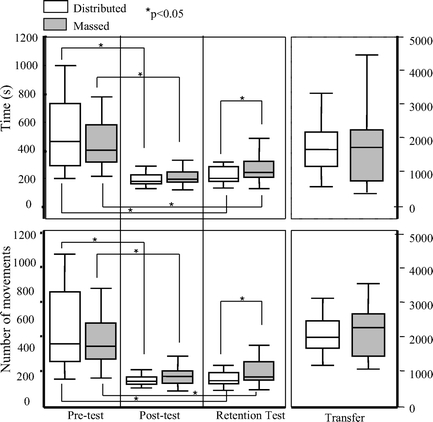
FIGURE 2. Box plots for both computer-based measures. The bar represents median, the box 25th to 75th percentile, and the whiskers the range of the data. Microsurgical drills (pre, post, and retention tests) and live rat (transfer) performances are plotted for time and number of dominant hand movements for the distributed (clear) and massed (shaded) groups. Significant (set at P < 0.05) differences between tests and between groups are highlighted with an asterisk.
