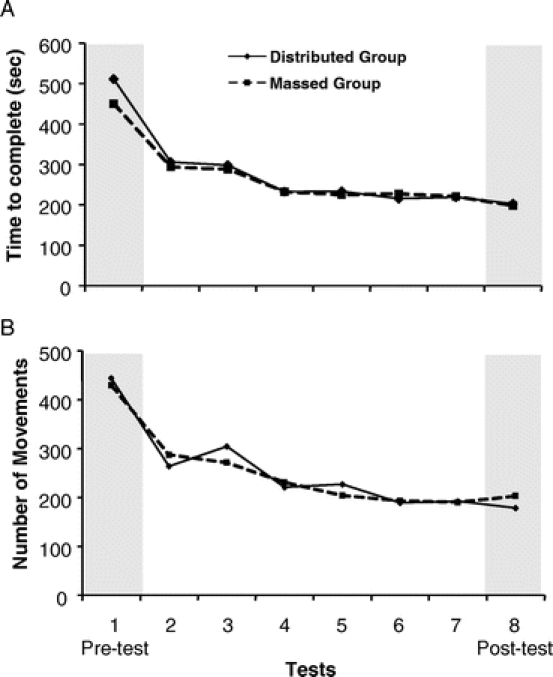
FIGURE 3. Learning curve of outcome measure (A, time to complete drill; B, number of dominant hand movements) versus test for both groups. Shaded areas represent the tests that were subsequently used as pre and post tests. There were 4 training sessions, and each participant was tested on the microsurgical drill immediately before and after each session.
