
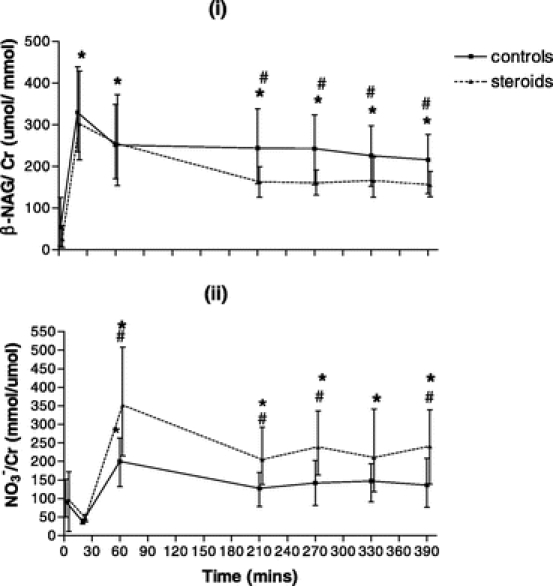
FIGURE 4. (i), Urinary N-acetyl-β-D-glucosaminidase/urinary creatinine ratios (NAG/Cr) throughout the perioperative time period in the controls (n = 21) and the steroid group (n = 21). (ii), Urinary nitrate/urinary creatinine ratios (NO3−/Cr) throughout the perioperative time period in the controls (n = 21) and the steroid group (n = 21). X-Y plot shows the median and interquartile range. #P < 0.05 between groups. *P < 0.05 within group compared with baseline.