
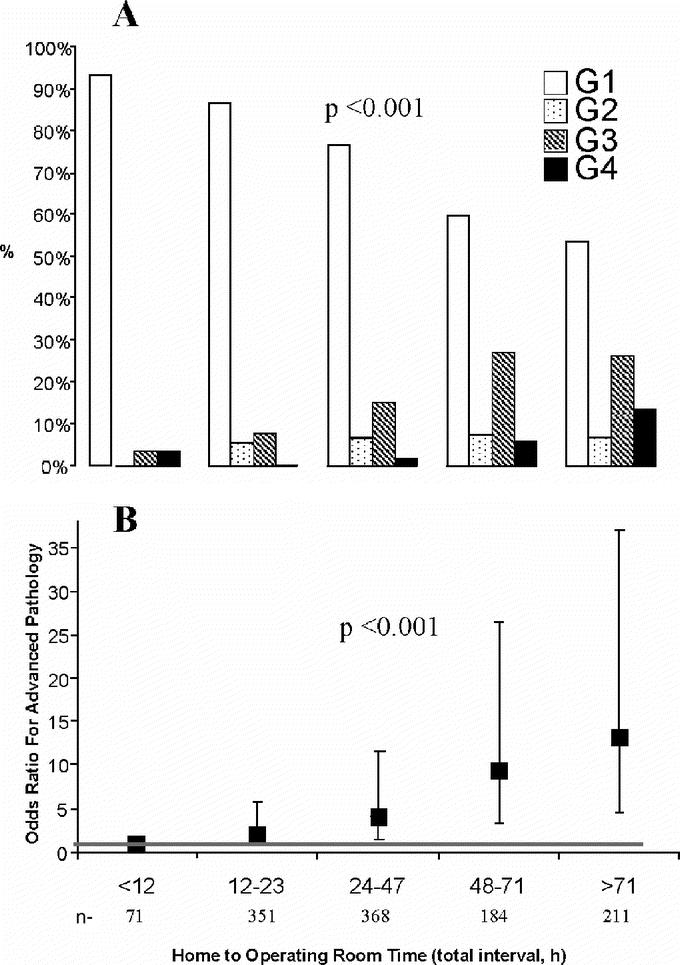
FIGURE 1. Relationship between advanced pathology and interval from onset of symptoms to surgery (total interval). A, Distribution of pathology grades per total intervals. B, Total interval and pathology grade proportions were compared using Mantel-Haenszel χ2 test for trend. Odds ratios (OR) compare the likelihood of advanced pathology for a given total interval to those with a total interval less than 12 hours. Bars represent 95% confidence intervals (CI) and the dashed line indicates OR = 1 (ie, if 1 is contained within the 95% CI, then the odds for advanced pathology for this total interval are not significantly different than the odds for the <12 hours group). G1–G4, pathology grades as defined in Patients and Methods.