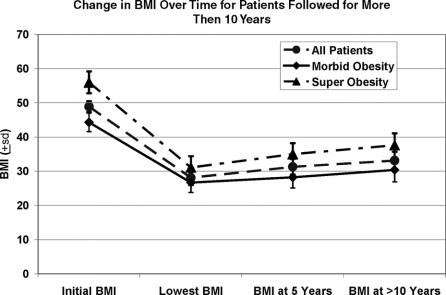
FIGURE 3. Plot of decrease of BMI against time for the 161 patients followed for more then 10 years (up to 15). The points represent the mean ± SD. Point 0 is the preoperative BMI. The nadir or lowest BMI occurred at 2.2 ± 1.9 years. The 5-year point represents a mean follow-up of 6.4 ± 3.2 years and the >10-year time point represents a follow-up of 12.3 ± 1.2 years. The superobese patients lost more quickly and gained more rapidly than the morbid obese (P < 0.0001). All increases in BMI from lowest to 5 and 10 year periods are significant (P < 0.0001).

An official website of the United States government
Here's how you know
Official websites use .gov
A
.gov website belongs to an official
government organization in the United States.
Secure .gov websites use HTTPS
A lock (
) or https:// means you've safely
connected to the .gov website. Share sensitive
information only on official, secure websites.
