
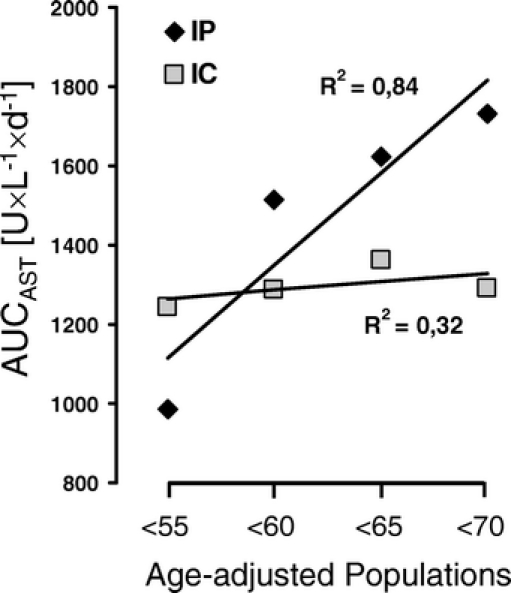
FIGURE 4. Age-adjusted correlation of AUCAST for the IP (solid rhomboid) and IC (open squares) group. Patients were backwards stepwise eliminated at 5-year intervals starting at the age of 70 years. The mean AUCAST were plotted against the different age groups <55, <60, <65, and <70 years. The degree of correlation is expressed by the correlation coefficient R2.