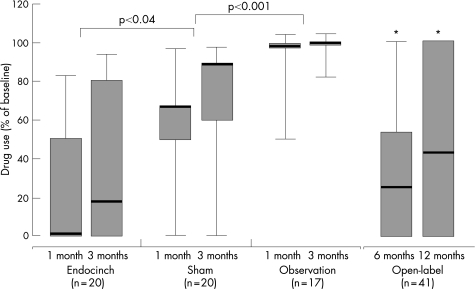
Figure 2 Drug use, expressed as percentage of the baseline dose of antisecretory drugs. The horizontal lines of the boxes denote the 25th, 50th (median) and 75th centile values. Error bars denote the 0 and 100th centiles. p Values apply to between‐group comparisons at 1 and 3 months. *p<0.001, compared with baseline.

An official website of the United States government
Here's how you know
Official websites use .gov
A
.gov website belongs to an official
government organization in the United States.
Secure .gov websites use HTTPS
A lock (
) or https:// means you've safely
connected to the .gov website. Share sensitive
information only on official, secure websites.
