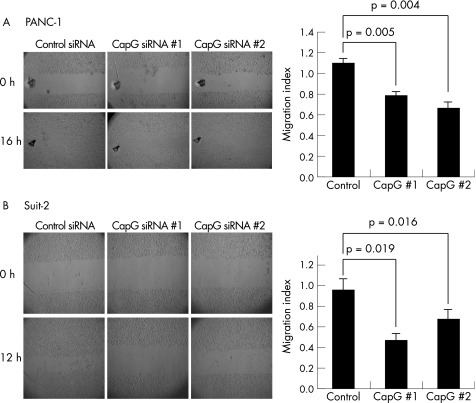
Figure 4 Knockdown of CapG by RNA interference inhibits wound healing. Data and representative images are shown for two cell lines: Panc‐1 (A) and Suit‐2 (B). Bars represent the migration index of each treatment, expressed as a value relative to the distance moved by the cell monolayer in a RISC‐free control. Error bars represent the SE for n = 5 (Panc‐1) and n = 6 (Suit‐2) experiments carried out in triplicate. The p values were obtained using the Student's paired t‐test, two‐tailed.

An official website of the United States government
Here's how you know
Official websites use .gov
A
.gov website belongs to an official
government organization in the United States.
Secure .gov websites use HTTPS
A lock (
) or https:// means you've safely
connected to the .gov website. Share sensitive
information only on official, secure websites.
