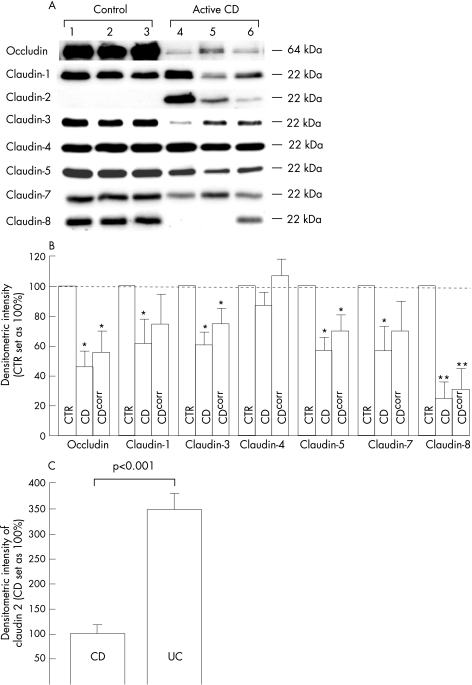
Figure 4 Expression of tight junction proteins as obtained from crude membrane fractions in immunoblots. (A) Western blot of three controls and three mild to moderately inflamed cases of Crohn's disease. Whereas claudin 2 could not be detected in all three controls, claudin 8 could not be detected in patients 4 and 5 with Crohn's disease. (B) Statistical evaluation by densitometry. Values represent means (SEM) of protein expression analysed in comparison with control values on the same blot, which were set as 100%. CTR, controls (n = 10). CD, patients with active Crohn's disease (n = 10). CDcorr, patients with active Crohn's disease corrected for the amount of protein and change in mucosal surface area. *p<0.05, **p<0.001 versus control. (C) Densitometric evaluation of claudin 2 expression in active Crohn's disease (CD; n = 6; set as 100%) and active ulcerative colitis (UC; n = 6). Values represent means (SEM) of protein expression analysed on the same blot.

An official website of the United States government
Here's how you know
Official websites use .gov
A
.gov website belongs to an official
government organization in the United States.
Secure .gov websites use HTTPS
A lock (
) or https:// means you've safely
connected to the .gov website. Share sensitive
information only on official, secure websites.
