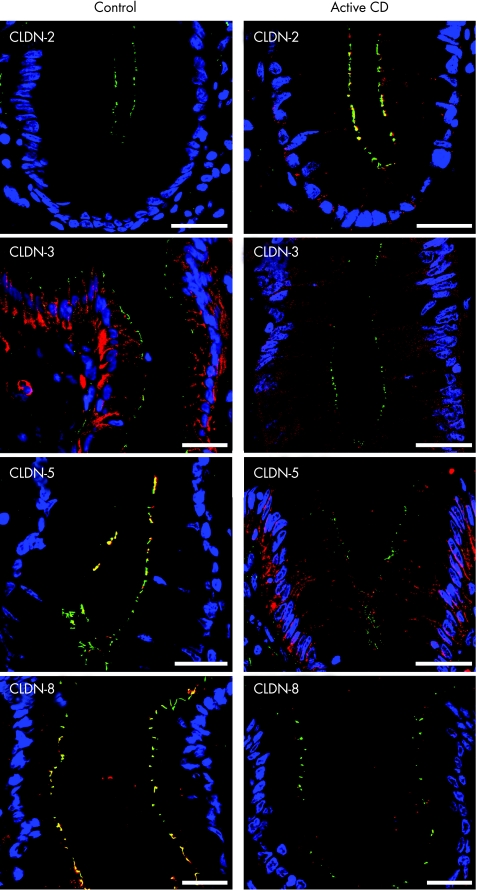
Figure 5 Merged pictures of ZO‐1 (green), the respective claudin (red) and nuclei (blue) as obtained by immunofluorescence analysis of biopsy specimens from sigmoid colon of control and active Crohn's disease. Pictures show the upper part of a crypt, except for claudin 2, which is shown at the base of a crypt. Claudin 2 was restricted to a subset of crypt cells in active Crohn's disease (tight junctional localisation) and was not detectable in controls. Claudin 3 showed an intense and predominantly lateral membrane staining in controls, whereas claudin 3 signal was distinctly reduced in active Crohn's disease with a diffuse cytoplasmic staining. In controls, claudin 5 showed tight junctional staining in both crypts and surface, whereas it was redistributed from the tight junction to the lateral plasma membrane in active Crohn's disease. Claudin 8 was strictly localised tight junctionally in surface and crypts of controls, whereas it stained weakly in the apical cytoplasm in active Crohn's disease mostly not colocalising with ZO‐1. Bar = 20 μm. For unmerged pictures and pictures of other claudins see fig A at http://www.gutjnl.com/supplemental.

An official website of the United States government
Here's how you know
Official websites use .gov
A
.gov website belongs to an official
government organization in the United States.
Secure .gov websites use HTTPS
A lock (
) or https:// means you've safely
connected to the .gov website. Share sensitive
information only on official, secure websites.
