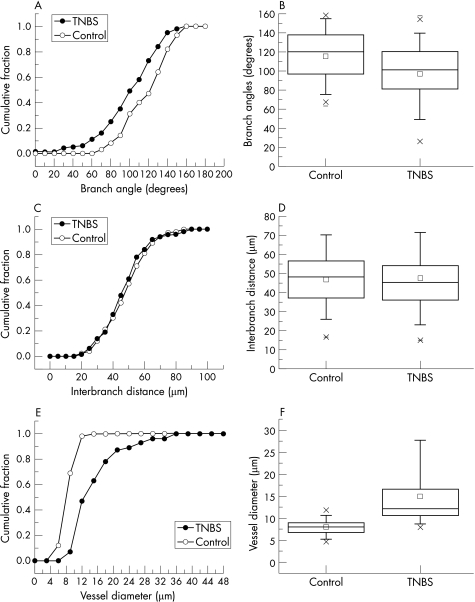
Figure 5 Morphometry of microvessels in the colon mucosal plexus in mice treated with 2,4,6‐trinitrobenzenesulphonic acid (TNBS; n = 25) or vehicle alone (n = 25) 96 h after the instillation of antigen. Morphometric measurements, including branch angles (A,B), interbranch distance (C,D), and vessel diameter (E,F), were obtained on images from three dimensional‐scanning electron microscopy and plotted as cumulative frequency histograms (A,C,E) and box charts (B,D,F). The box charts show the 25–75 centile with 2 standard deviations of the mean delineated by error bars.

An official website of the United States government
Here's how you know
Official websites use .gov
A
.gov website belongs to an official
government organization in the United States.
Secure .gov websites use HTTPS
A lock (
) or https:// means you've safely
connected to the .gov website. Share sensitive
information only on official, secure websites.
