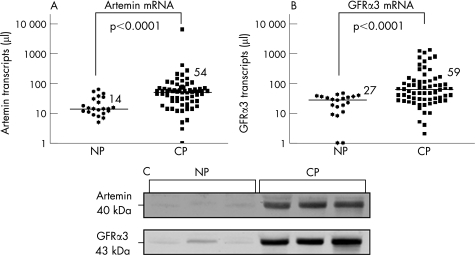
Figure 1 Artemin and glial derived neurotrophic factor family receptor (GFR)α3 expression in pancreatic tissues. Artemin (A) and GFRα3 (B) mRNA expression analysed by quantitative reverse transcription‐polymerase chain reaction (QRT‐PCR) in chronic pancreatitis (CP) (n = 66) and in normal pancreas (NP) (n = 22). Transcript numbers are presented on a logarithmic scale. The horizontal bars represent the median values. (C) Western blot analysis of artemin and GFRα3 mirrors the upregulation of artemin mRNA expression. Note the significant increase in both proteins in chronic pancreatitis compared with the normal pancreas.

An official website of the United States government
Here's how you know
Official websites use .gov
A
.gov website belongs to an official
government organization in the United States.
Secure .gov websites use HTTPS
A lock (
) or https:// means you've safely
connected to the .gov website. Share sensitive
information only on official, secure websites.
