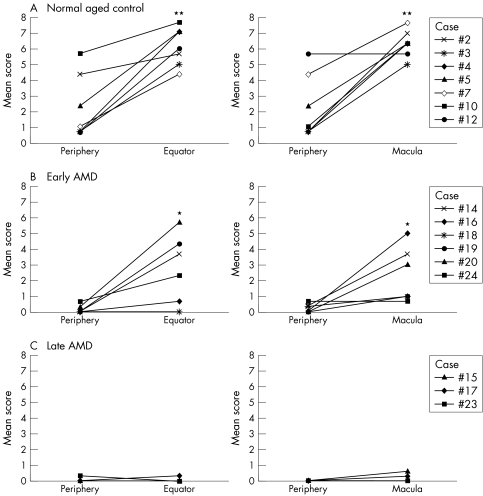
Figure 4 Geographic difference in TSP‐1 expression in Bruch's membrane of normal control eyes (A), early AMD (B), and late AMD (C). Mean scores for TSP‐1 immunoreactivity in periphery, equator, and macula are represented in the graphs. (Significant differences compared to periphery by Wilcoxon signed rank test: *p<0.001 and **p<0.0001.)

An official website of the United States government
Here's how you know
Official websites use .gov
A
.gov website belongs to an official
government organization in the United States.
Secure .gov websites use HTTPS
A lock (
) or https:// means you've safely
connected to the .gov website. Share sensitive
information only on official, secure websites.
