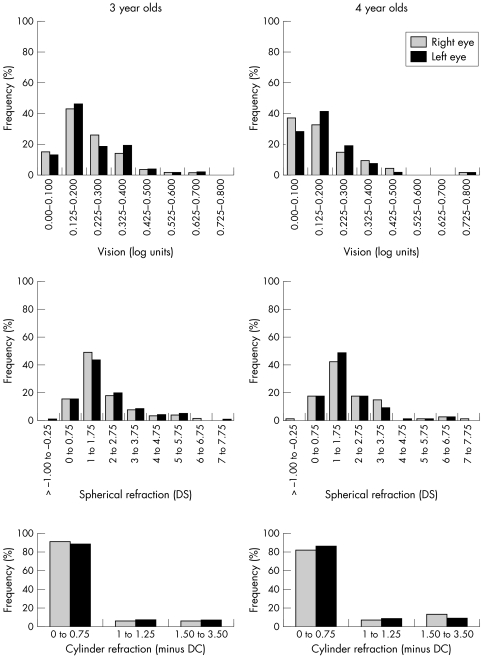
Figure 1 Frequency distribution of vision scores in log units scored by line (top row), spherical refraction (middle row), and cylinder refraction (bottom row), for the right eye (shaded) and left eye (solid) of all 3 year old (left column) and 4 year old (right column) children who fulfilled the inclusion criteria. All vision scores are uncorrected acuity. Refraction values shown are for full cycloplegic refraction with allowance for working distance removed. Cylinder values were recorded in minus form. (Snellen equivalents values: 0.00 = 6/6; 0.100 = 6/7.5; 0.200 = 6/9; 0.300 = 6/12; 0.400 = 6/15; 0.500 = 6/19; 0.600 = 6/24; 0.700 = 6/30; 0.800 = 6/38.)

An official website of the United States government
Here's how you know
Official websites use .gov
A
.gov website belongs to an official
government organization in the United States.
Secure .gov websites use HTTPS
A lock (
) or https:// means you've safely
connected to the .gov website. Share sensitive
information only on official, secure websites.
