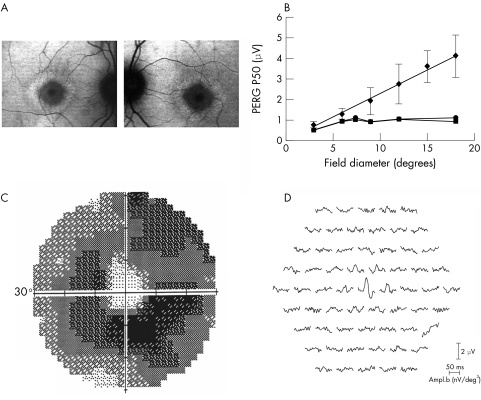
Figure 5 Fundus autofluorescence (A), Humphrey visual fields (C) and multifocal ERGs (D) in a patient with rod‐cone dystrophy and normal visual acuity. The graph shows PERG P50 amplitude to different sizes of circular checkerboard (B); mean normal values are shown for eight subjects. Error bars show 1 SD either side of the mean.

An official website of the United States government
Here's how you know
Official websites use .gov
A
.gov website belongs to an official
government organization in the United States.
Secure .gov websites use HTTPS
A lock (
) or https:// means you've safely
connected to the .gov website. Share sensitive
information only on official, secure websites.
