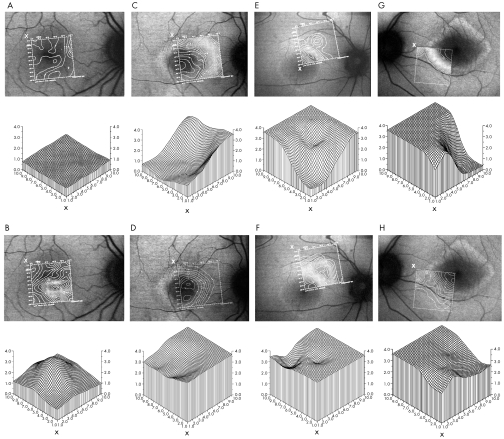
Figure 7 Contour sensitivity plots obtained in one normal subject (column 1) and in the same three patients described in figures 5, 6, and 10 (columns 2, 3, and 4) under photopic (row 1) and scotopic (row 3) conditions. Three dimensional threshold plots represent values obtained at corresponding retinal locations under photopic (row 2) and scotopic (row 4) conditions. Labelling (x) shows correspondence between the orientation of contour and threshold plots. Abscissa shows retinal location (degrees), ordinate axes show threshold (log units). Three dimensional plots in column 1 show averaged data from 10 (photopic) and eight (scotopic) normal subjects.

An official website of the United States government
Here's how you know
Official websites use .gov
A
.gov website belongs to an official
government organization in the United States.
Secure .gov websites use HTTPS
A lock (
) or https:// means you've safely
connected to the .gov website. Share sensitive
information only on official, secure websites.
