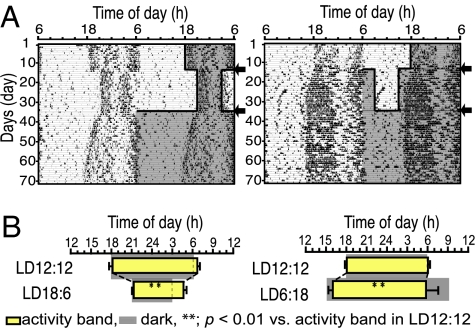
Fig. 1.
Circadian behavioral rhythms in different photoperiods. (A) Representative double-plotted circadian rhythms in spontaneous locomotor activity of a mouse transferred to LD18:6 (Left) and LD6:18 (Right) from LD12:12. The dark phase is shaded in the right-hand side of each actograph. Arrows indicate day of photoperiod transfer. (B) Phase relations of activity rhythms to different photoperiods. Yellow bars indicate activity bands (mean ± SD). Gray areas indicate dark phase.

