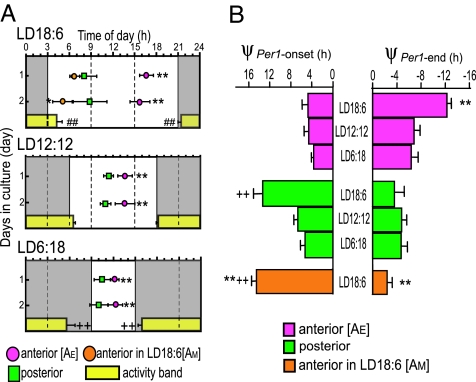
Fig. 3.
Correlation between behavior rhythms and Per1-luc rhythms in anterior and posterior SCN. (A) Phase relationships between the anterior and posterior peaks of the first two days in different photoperiods. Symbols: peak phase (mean ± SD in hours; n = 8 in LD18:6, n = 9 in LD12:12, and n = 8 in LD6:18). Gray areas, subjective night. ∗ and ∗∗, P < 0.05 and 0.01, respectively, vs. posterior peak. Horizontal yellow bars, activity band (mean ± SD). + and ++, P < 0.05 and 0.01, respectively, vs. ψon or ψend in LD12:12. ##, P < 0.01 ψon or ψend in LD18:6 vs. those in LD6:18. (B) Phase differences (ψ) between the peak of Per1-luc expression rhythm and activity onset (ψPer1-onset, Left), and between the peak and end of activity (ψPer1-end, Right) in three photoperiods. Phase angle differences between the activity and bioluminescence rhythms were measured for each animal and averaged (mean ± SD). ∗∗, P < 0.01 vs. anterior SCN in LD12:12; + and ++, P < 0.05 and 0.01, respectively, vs. posterior SCN in LD12:12.

