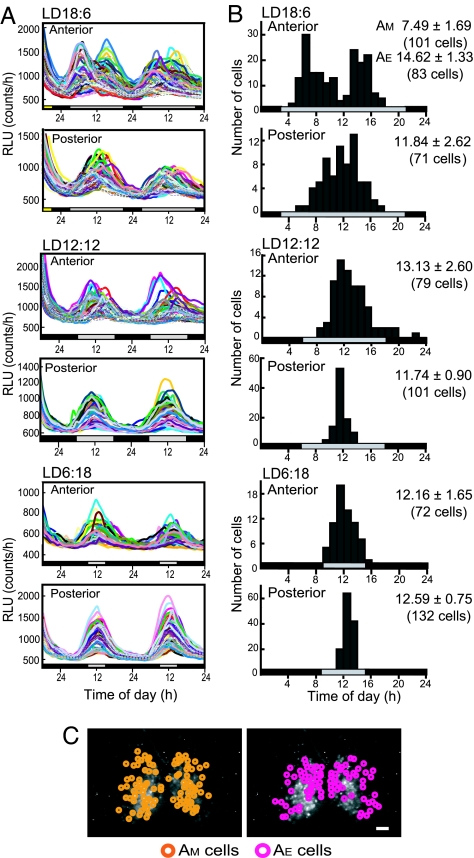
Fig. 5.
Spatial and temporal distributions of circadian rhythms in Per1-luc from single SCN cells in different photoperiods. (A) Forty-eight-hour profiles of bioluminescence of individual cells in the anterior and posterior SCN slices obtained from a mouse in LD18:6 (Top), LD12:12 (Middle) and LD6:18 (Bottom). (B) Temporal distribution of individual circadian peaks (on day 1) from the same SCNs indicated in A. Distribution peaks were expressed in each graph with the mean and SD of individual circadian peaks. See SI Fig. 8 for the peak distribution of the total cells from 3 SCNs. (C) Spatial distribution of cells with the morning (AM, orange) and evening peaks (AE, pink) in the anterior SCN under LD18:6 shown in A. (Scale bar: 100 μm.)

