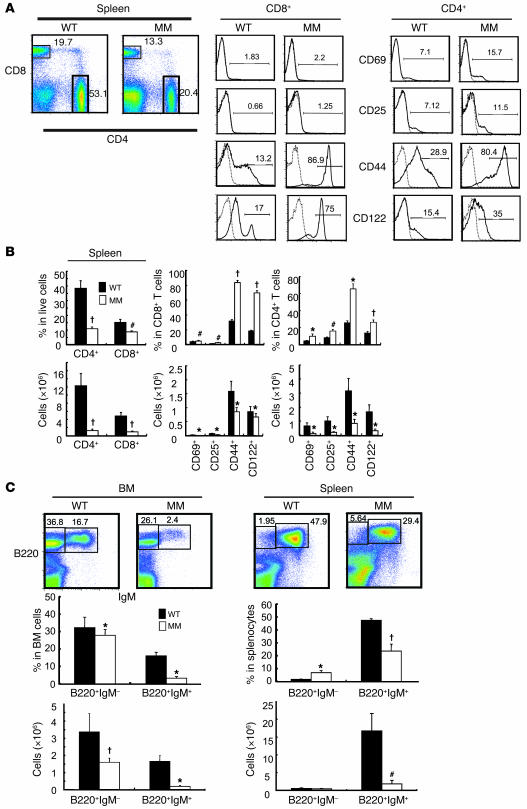
Figure 3. T and B cell development in MM mice is inhibited at receptor gene rearrangement stages.
(A) The memory/activated phenotype of CD4+ and CD8+ T cells in the spleen was analyzed by FACS. Numbers denote percentage of cells within the indicated gates or bracketed ranges. (B) The percentage and number of CD4+ (P < 0.001 and P < 0.001, respectively) and CD8+ (P = 0.001 and P < 0.001, respectively) T cells in the spleen was lower in MM than in wild-type mice. The percentages of CD8+CD69+ (P = 0.006), CD8+CD25+ (P = 0.001), CD8+CD44+ (P < 0.001), CD8+CD122+ (P < 0.001) and CD4+CD69+ (P = 0.02), CD4+CD25+ (P = 0.001), CD4+CD44+ (P = 0.02), and CD8+CD122+ (P < 0.001) cells were higher in MM than in wild-type mice. Data were calculated using the FACS profiles in A. (C) The percentage and number of bone marrow B220+IgM– (P = 0.03 and P < 0.001, respectively) and B220+IgM+ (P = 0.01 and P = 0.02, respectively) cells as well as splenic B220+IgM+ cells (P < 0.001 and P = 0.002, respectively) were lower in MM mice than in wild-type mice. *P < 0.05, #P < 0.01, †P < 0.001 versus wild type.

