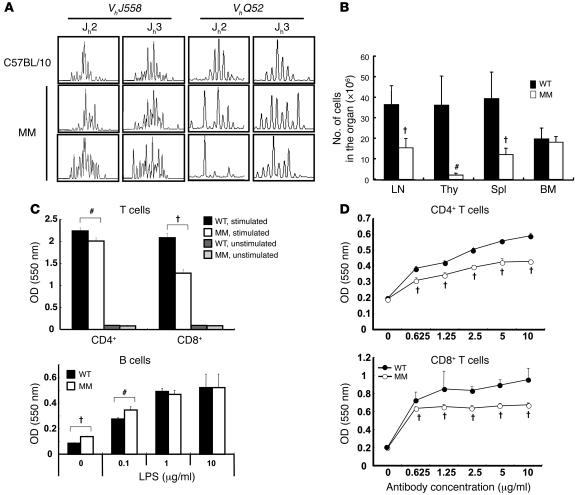
Figure 4. T and B cell development in MM mice is inhibited at receptor gene rearrangement stages.
(A) Spectratypes of VhJ558 and VhQ52 family genes were performed using splenocytes from MM mice and C57BL/10 controls. Representative data are shown. (B) The number of cells in the MM mouse lymph nodes (inguinal, axillaries, cervical, and mesenteric; P < 0.001), thymus (Thy; P = 0.005), and spleen (Spl; P < 0.001) than in those of wild-type mice. Results are mean and SD of 5–6 mice (6–9 weeks old). (C and D) CD4+ and CD8+ T cells were sorted from spleens and lymph nodes of MM and control mice and stimulated by 10 μg/ml (C, top) and indicated concentrations of anti-CD3 and anti-CD28 (D). MTT assay showed less T cell proliferation in MM than in wild-type cells (stimulated CD4+, P = 0.002; stimulated CD8+, P < 0.001; CD4+ and CD8+ at all concentrations, P < 0.001). (C, bottom) B220+CD19+ B cells were sorted from spleens of MM and control mice and stimulated by indicated concentrations of LPS. MTT assay showed more B cell proliferation in MM than in wild-type cells stimulated with 0 μg/ml LPS (P < 0.001) or 0.1 μg/ml LPS (P = 0.001). #P < 0.01, †P < 0.001 versus wild type.

