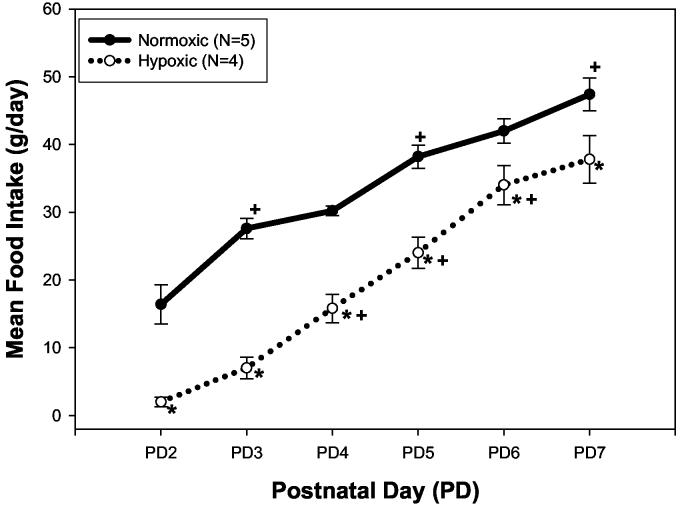
Figure 1.
Mean food intake (g/day) of nursing dams exposed to normoxia (21% O2) or hypoxia (12% O2) from delivery to postnatal (PD) 7. Dams were fed ad libitum and individual daily food intake was recorded. Data are reported as mean ± SEM for each group at each time point (Normoxia N=5; Hypoxia N=4). * Indicates a significant difference from Normoxia at the indicated time point with p<0.05. + Indicates a significant increase in food intake from the previous time point within the specified treatment group with p<0.05.

