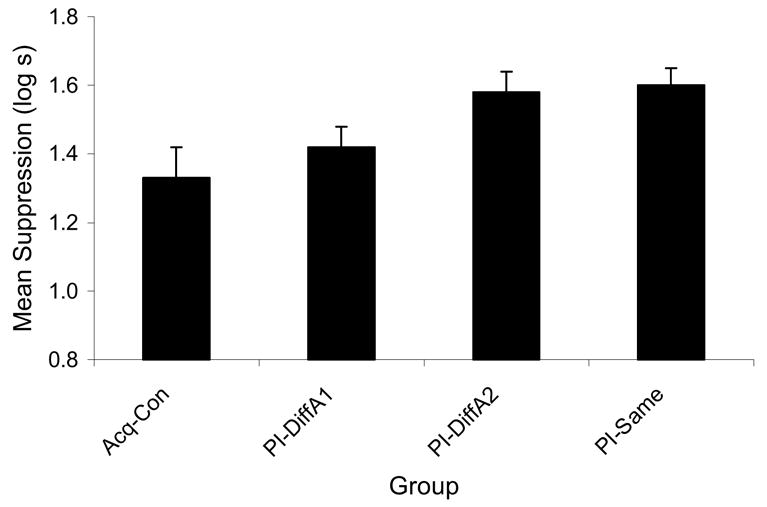
Figure 4.

Means of Experiment 2 from the CS A test. The PI-DiffA2 and PI-Same groups were those in which strong responding to cue A was expected due to prior training of the competing cue in Phase 1. Higher bars indicate stronger suppression and lower bars indicate weaker suppression. Weaker responding to cue A was expected in Group PI-DiffA1 because cue A emanated from a location different from that when it had been reinforced. Discrimination of the reinforced and nonreinforced locations is evident in the lower responding to cue A in Group PI-DiffA1 than in Group PI-DiffA2.
