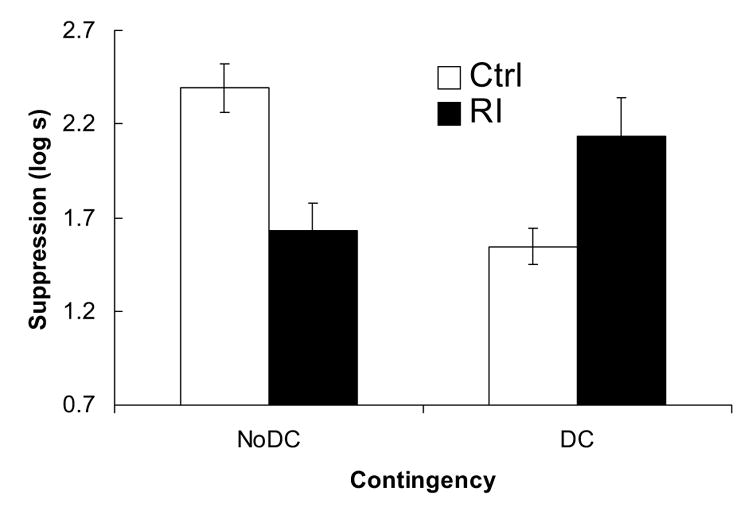
Figure 1.

Experiment 1. The bars depict the mean suppression scores for the four groups. Larger bars denote longer latencies to resume drinking in the presence of the CS. Thus, smaller bars suggest less fear to the target stimulus. The error bars represent the standard error for each group.
