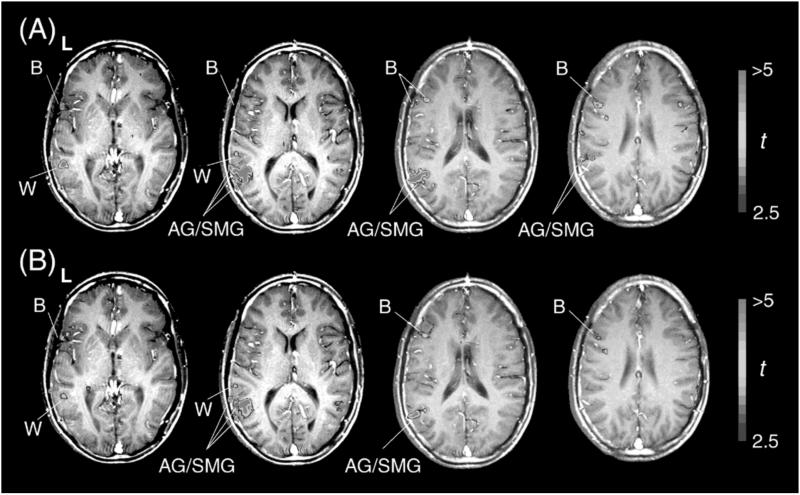
Figure 1.
Cortical activation in GR and SP conditions. Thresholded fMRI images in t-maps were superimposed on structural images showing z = 4, 12, 20, and 28 horizontal slices (see Table 3) for a single representative subject. The left side (L) of the brain is shown left. (A) GR vs. CO; (B) SP vs. CO. The color bars at right indicate the t-values of the comparison. Activation in the GR condition is generally greater in language areas than activation in the SP condition; this difference is particularly prominent in Broca's area (B), compared with Wernicke's area (W) and AG/SMG.

