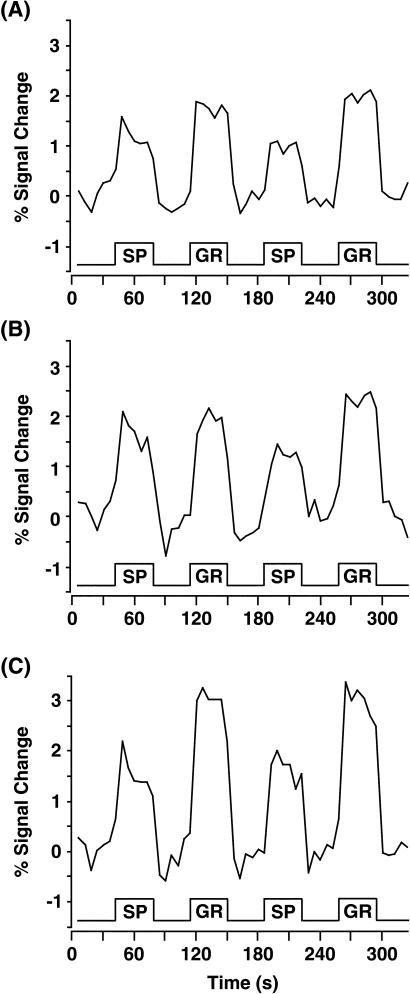
Figure 2.
Mean-time series for each region of interest in the study. The ordinate indicates percent signal change; the abscissa is time, with stimulus blocks indicated and labeled. The time courses show stimulus-locked activation for each of the three language areas in the left hemisphere: AG/SMG (A), Wernicke (B), and Broca (C).

