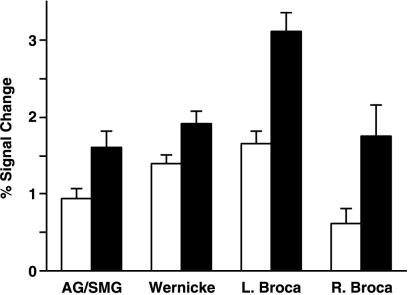
Figure 3.
The effect of two language conditions in the language areas. Histogram comparing the values for percent signal change (mean ± SEM of subjects and blocks) for each language condition vs. CO (white = SP, black = GR) is shown in each region of interest. Note the prominent condition difference in left Broca's area (L. Broca), which is larger than in other language areas and the right homolog of Broca's area (R. Broca).

