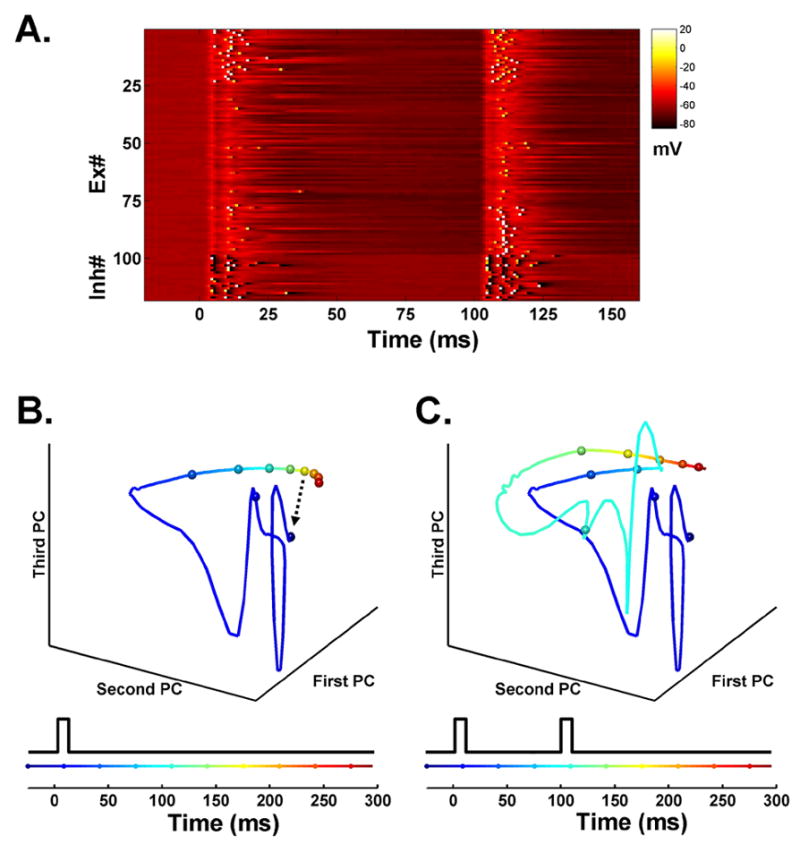
Figure 1. State-dependent network simulation.

(A) Voltage plot of a subset of neurons in the network. Each line represents the voltage of a single neuron in response to two identical events separated by 100 ms. The first 100 lines represent 100 Ex units (out of 400), and the remaining lines represent 25 Inh units (out of 100). Each input produces a depolarization across all neurons in the network, followed by inhibition. While most units exhibit subthreshold activity, some spike (white pixels) to both inputs, or exclusively to the first or second. The Ex units are sorted according to their probability of firing to the first (top) or second (bottom) pulse. This selectivity to the first or second event arises because the difference in network state at t=0 and t=100 ms.
(B) Trajectory of the three principal components of the network in response to a single pulse. There is an abrupt and rapidly evolving response beginning at t=0, followed by a slower trajectory. The fast response is due to the depolarization of a large number of units, while the slower change reflects the short-term synaptic dynamics and slow IPSPs. The speed of the trajectory in state space can be visualized by the rate of change of the color code and by the distance between the 25 ms marker spheres. Because synaptic properties cannot be rapidly 'reset', the network cannot return to its initial state (arrow) before the arrival of a second event.
(C) Trajectory in response to a 100 ms interval. Note that the same stimulus produces a different fast response to the second event. To allow a direct comparison, the principal components from B were used to transform the state data in C.
