
Figure 6. Dependence of the State-dependent Network on Initial State.
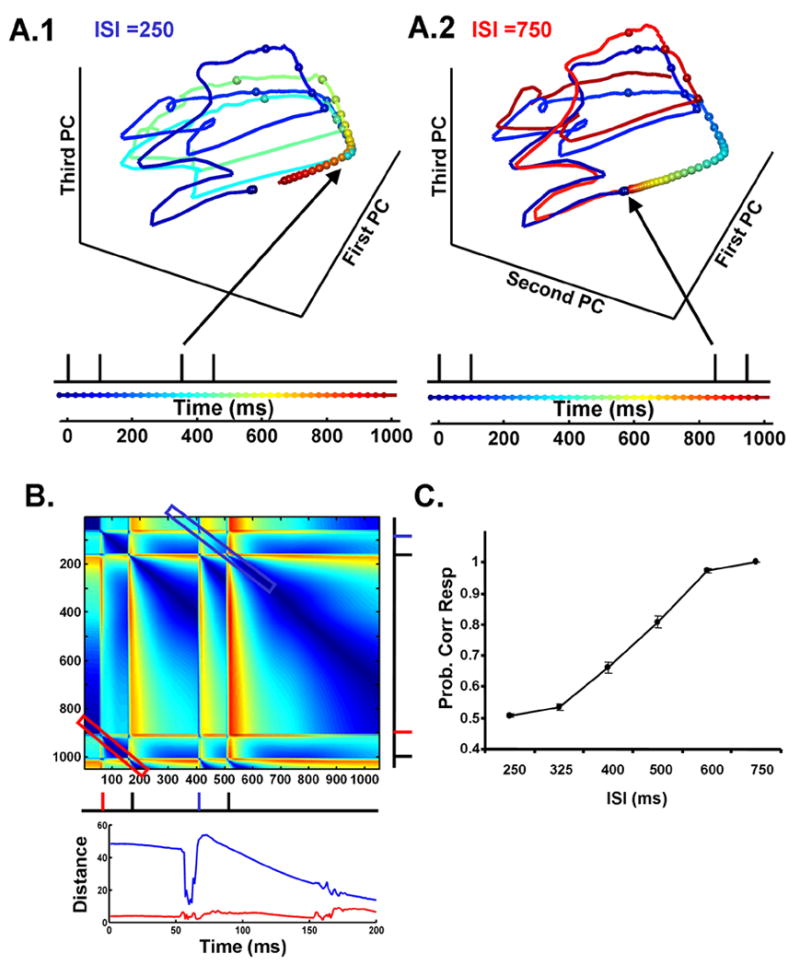
(A) Trajectory of the same network shown in Fig. 1 and 2, in response to two 100 ms intervals separated by a 250 (A1) or 750 ms ISI (A2). Note, that the trajectories under the 750 ms ISI are much closer to overlapping than in the 250 ms condition. Arrows indicated the times of the onset of the second interval.
(B) Distance matrix. The diagonal represents the distance in Euclidean space between the trajectories shown in A1 and A2 starting at 0. The distance is zero until the onset of the second tone (the noise ‘seed’ was the same for both simulations). The secondary diagonals permit the visualization of the distances between two trajectories shifted in time. This allows the comparison of the trajectory starting at the onset of the second interval (for the 250 ms ISI) and of the first interval (blue rectangle and blue line in lower panel), or the second interval of the 750 ms ISI and the first interval (red rectangle and red line in lower panel). These distances, shown in the lower panel, allows for quantification of the effect of the network not returning to its initial (resting) state before presenting the next stimulus. Note that while the initial distance is lower in the 750 ms ISI, it is not zero.
(C) Percent correct performance of networks trained to discriminate two intervals separated by varying ISIs. Average data from four stimulations. Output units were trained to discriminate intervals ranging from 50 – 150 ms. Performance was then tested by examining generalization to these same intervals when presented at varying ISIs after the presentation of a 100 ms interval. Results for the 100 x 150 ms discrimination are shown. Performance is highly dependent on the initial state of the network.