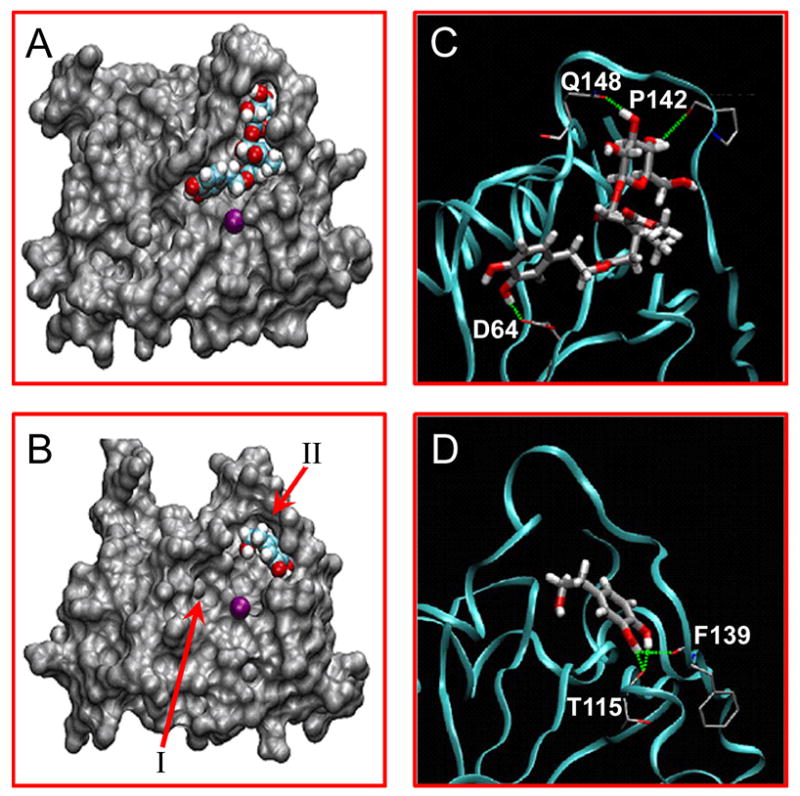
Figure 1. Molecular docking of Ole and HT with HIV-1 integrase.

The predicted binding structures of Ole (A) and HT (B) inside the HIV-1 integrase catalytic site. Integrase is shown as a surface model, while Ole and HT are shown as van der Waals models and the purple sphere represents Mg2+. Hydrogen bonds formed by Ole (C) and HT (D) with integrase are indicated as green dotted lines, and the integrase backbone is represented by the cyan ribbon.
