
Figure 3.
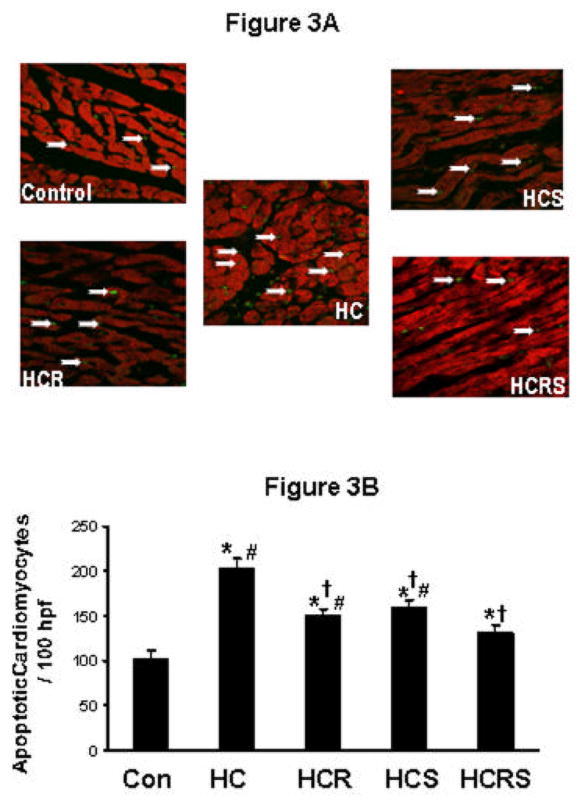
Cardiomyocyte apoptosis by TUNEL assay. Representative pictures show immunohistochemical staining of extended DNA. A: shows the extent of cardiomyocyte apoptosis between the comparative groups. B: shows the graphical representation of cardiomyocyte apoptosis. Data were expressed as a percentage of the total particular cell nuclei on counts per 100 high power fields. Values are mean ± Std. error (n=6). *P<0.05 compared to control, †P<0.05 compared to HC group, #P<0.05 compared to HCRS group. 100 hpf - represents 100X high power field.