
Figure 2.
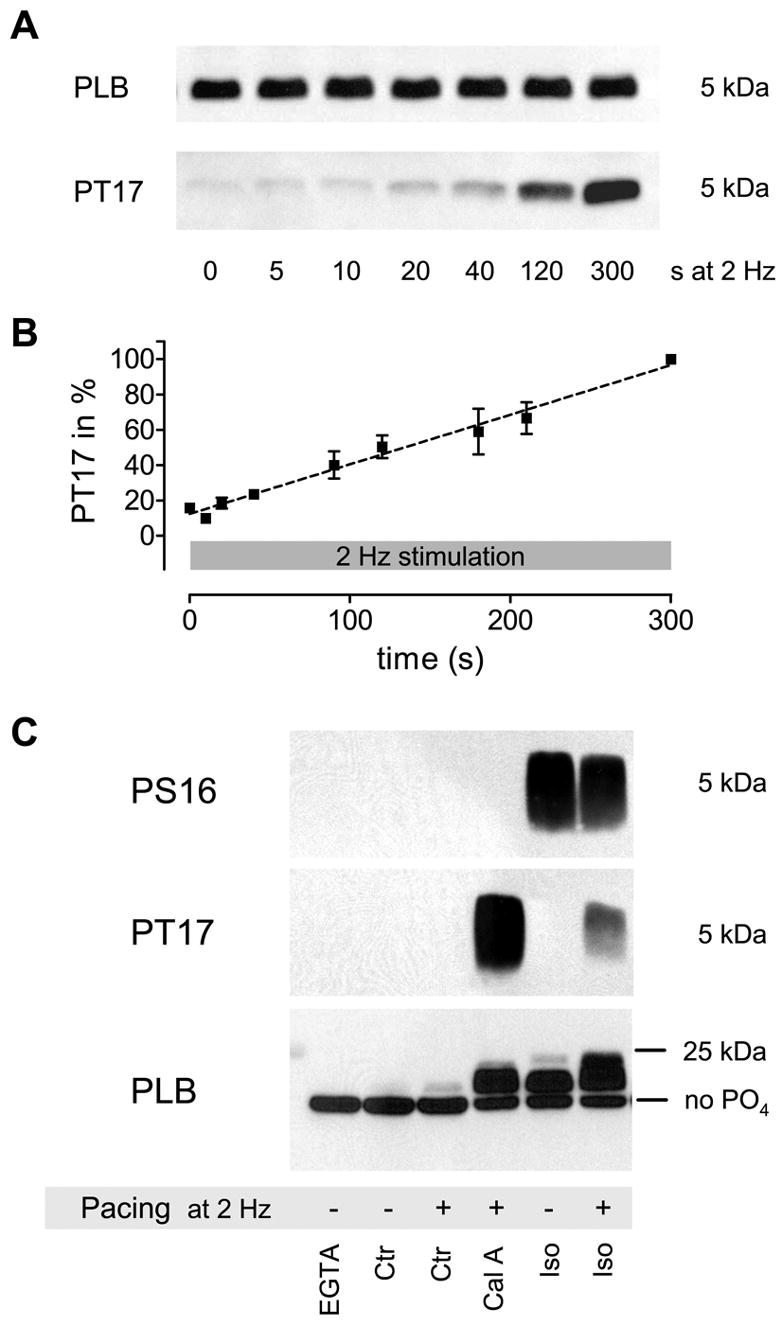
Increase in PLB Threonine 17 phosphorylation (PT17) in response to pacing at 2 Hz (a, b). Phosphorylation increases linear and does not reach steady-state within 300 s (n = 2–10; all signals normalized to 300 s (=100 %)). Total PLB was measured in the same samples on a different blot and used as loading control. PLB Ser-16 phosphorylation did not change within that timeframe (data not shown). For total PLB quantification 4 μg of protein were loaded into each lane, while for PLB phosphorylation (PS16 and PT17) 40 μg were used. Semi-quantitative analysis of total PLB-phosphorylation levels (c). The increase in the apparent molecular weight and subsequent upward shift of the PLB pentamer in SDS-PAGE relative to its phosphorylation level revealed that only a very small amount becomes phosphorylated in response to pacing alone that is likely less than 5% of total PLB (the position of unphosphorylated PLB is indicated (no PO4)). This estimate is derived from the long exposure times needed to detect a signal in the paced control (Ctr+) sample in panel 2 (actually not visible due to a shorter exposure shown here) and the upward shift in panel 3 (some bands are overexposed to visualize the difference between Ctr- and Ctr+). Higher PLB phosphorylation is achieved by phosphatase-inhibition plus pacing (Cal A; mostly Thr-17 phosphorylation), Iso without pacing (Iso-; mostly Ser-16 phosphorylation) and Iso plus pacing (Iso+; some dual phosphorylation). This result is representative of five similar experiments.