
Figure 5. Epitope-specific IFN-γ-producing CD4+ T cells in the CNS of WT or mutant virus-infected mice.
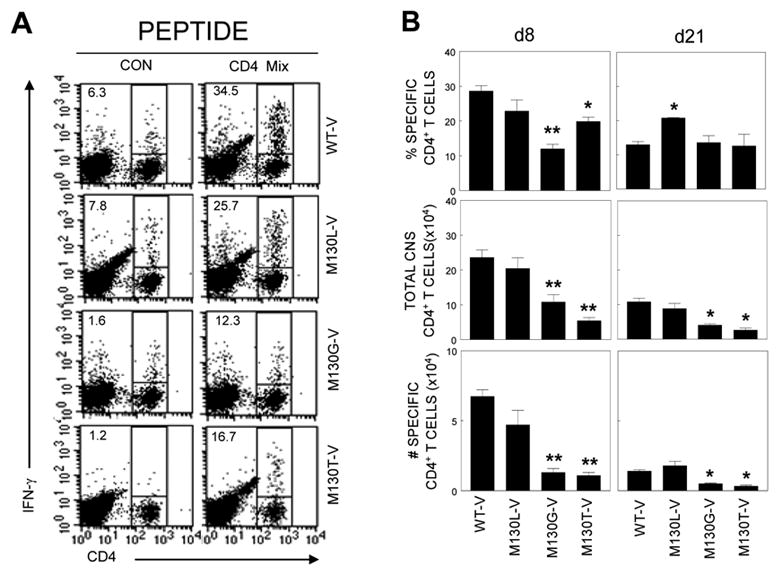
A, Isolated CNS-infiltrating MNC were re-stimulated with a mixture of CD4+ T cell-specific epitopes (VP2206–220 and VP425–38) for 6 hours. Cells were stained for CD4 and intracellular IFN-γ. The percentage of CD4+ and IFN-γ+ cells is shown on the upper left corner of each plot. Data are representative of 3 independent experiments. B, Histograms represent the mean of percentage or numbers of 2–3 independent experiments by FACS analysis. Proportion of epitope-specific CD4+ T cells (Top panel), total number of CNS-infiltrating CD4+ T cells (middle panel), and the number of epitope-specific CD4+ T cells in the CNS (bottom panel) is shown.