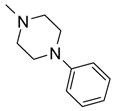
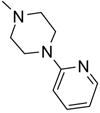
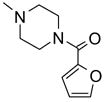
Table 1. SPE with reconditioned cartridgesa.

| NRR' =-NHBu |

|

|

|

|

|
|
| run | 5a | 5b | 5c | 5d | 5e | 5f |
| 1 | 11mg | 11mg | 15mg | 15mg | 14mg | 13mg |
| 2 | 12 | 11 | 16 | 15 | 16 | 19 |
| 3 | 11 | 11 | 15 | 14 | 16 | 18 |
| 4 | 12 | 9 | 16 | 14 | 16 | 19 |
| 5 | 13 | 13 | 15 | 16 | 17 | 19 |
| 6 | 12 | 11 | 15 | 15 | 15 | 17 |
| 7 | 15 | 11 | 15 | 15 | 16 | 18 |
| 8 | 11 | 10 | 16 | 10 | 16 | 13 |
| 9 | 12 | 9 | 16 | 16 | 16 | 19 |
| 10 | 15 | 12 | 18 | 17 | 11 | 20 |
1% sample loading in THF (0.25 mL), samples were collected in 80:20 MeOH/H2O (2x3 mL) fractions, cartridges were washed with MeOH (2x3 mL), acetone (2x3 mL), and then reconditioned with 80:20 MeOH/H2O (2x3 mL) for next runs.
