Figure 5.
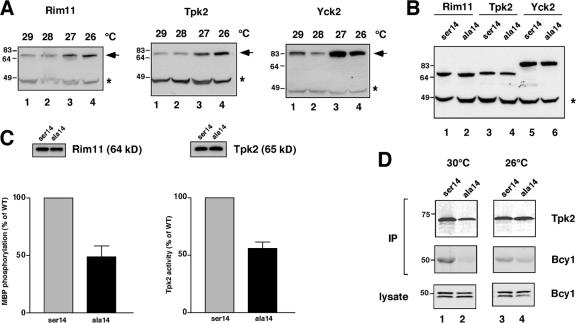
Effect of temperature on kinase accumulation and activity. (A) Western blot analysis of Rim11, Tpk2, and Yck2 (arrows) after growth of the relevant TAP-tagged cdc37S14A strains at the indicated temperatures. Asterisks denote Pgk1, which was used as a loading control. (B) Comparison of Rim11 (lanes 1 and 2), Tpk2 (lanes 3 and 4), and Yck2 (lanes 5 and 6) levels by Western blotting in whole cell extracts from wild-type (ser14) and cdc37S14A (ala14) cells grown at 26°C. The asterisk denotes Pgk1. (C) Activity of protein kinases in the cdc37 mutant strain. Activity of Rim11 and Tpk2 after growth of the relevant TAP-tagged wild-type (WT) and cdc37S14A cells at 26°C. The blots above the graph show Western blot analysis of protein levels of the kinases used in the assays. Error bars represent SEM. (D) Binding of HA-Bcy1 to Tpk2 in wild-type (ser14; lanes 1 and 3) and cdc37S14A (ala14; lanes 2 and 4) cells grown at 30 and 26°C as indicated. Top panels show Western blots of Tpk2; middle panels show HA-Bcy1 (Bcy1) after immunoprecipitation (IP) of TAP-Tpk2 using IgG–Sepharose beads; bottom panel shows levels of HA-Bcy1 in cell lysates. Note that two bands appear in the anti-HA Western blots, but only the slower migrating band coimmunoprecipitated with TAP-Tpk2 (not depicted).

