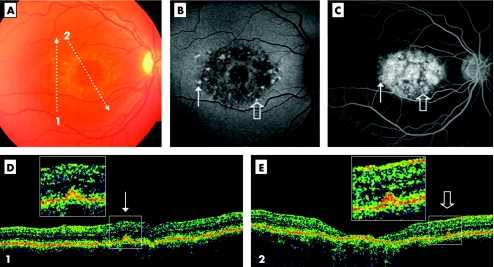
Figure 1 Stratus optical coherent tomography (OCT) demonstrates type 1 deposits facing retinal flecks (case 5, RE). Colour photograph shows macular atrophy and retina flecks (A). OCT scans are illustrated by the arrows 1 and 2. The autofluorescent frame (confocal) clearly delineates the retinal flecks (B). Thin and open arrows point out two of the flecks, respectively crossed by scans 1 and 2. Fluorescein angiography shows the dark choroid appearance (C). The hypofluorescent flecks (arrows) are hardly discernable in the hyperfluorescent background because of retinal pigment epithelium (RPE) changes. The OCT scan 1 (D) shows a small hyper‐reflective lesion located at the inner part of the RPE layer (thin arrow), called type 1 deposit. The OCT scan 2 (E) shows a similar feature (open arrow) and macular atrophy. Squares illustrate enlarged view of these little dots that appear to correspond to the accumulation of autofluorescent material marked by the arrows.

An official website of the United States government
Here's how you know
Official websites use .gov
A
.gov website belongs to an official
government organization in the United States.
Secure .gov websites use HTTPS
A lock (
) or https:// means you've safely
connected to the .gov website. Share sensitive
information only on official, secure websites.
