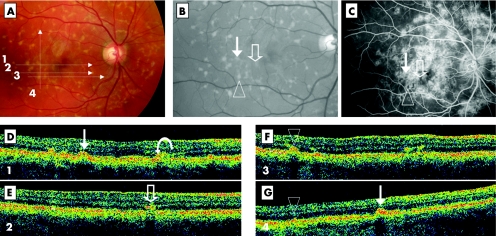
Figure 4 Both type 1 and type 2 FFM deposits visualised by Stratus OCT within the same eye (case 12, LE). Colour photograph shows numerous retinal flecks (A). The 5 mm OCT scans are illustrated by the four numbered arrows. In the red free frame (enlarged view), the flecks appear slightly more contrasted (B). No profound macular atrophy is visible. Thin arrow, open arrow, and arrowhead point out three of the flecks crossed by the OCT scans. Fluorescein angiography shows ill defined hyperfluorescence around the macular area and a dark choroid appearance on the temporal side (C). Arrows are marked on the corresponding locations. On OCT scan 1 (D), a dome‐shaped elevation of the RPE level (type 1, thin arrow) is observed. On the same scan, two other lesions are visible: a deposit within the photoreceptor layer (type 2, on the left side of the arrow) and a lesion, intermediate between the type 1 and type 2 patterns (curved arrow). On OCT scan 2 (E), a typical type 2 deposit is observed, clearly distinct from the RPE layer (open arrow). This hyper‐reflective deposit does not clearly correlate with the well defined flecks on colour photography but could correspond to a hypofluorescent lesion on fluorescein angiography (open arrow). On OCT scan 3 (F), a type 1 deposit is observed (triangle) as well as two small type 2 deposits on the right side, suggesting heterogeneous aspect of the same lesion type. On OCT scan 4 (G) the type 1 deposits corresponding to the arrowhead and the thin arrow are shown again.

An official website of the United States government
Here's how you know
Official websites use .gov
A
.gov website belongs to an official
government organization in the United States.
Secure .gov websites use HTTPS
A lock (
) or https:// means you've safely
connected to the .gov website. Share sensitive
information only on official, secure websites.
