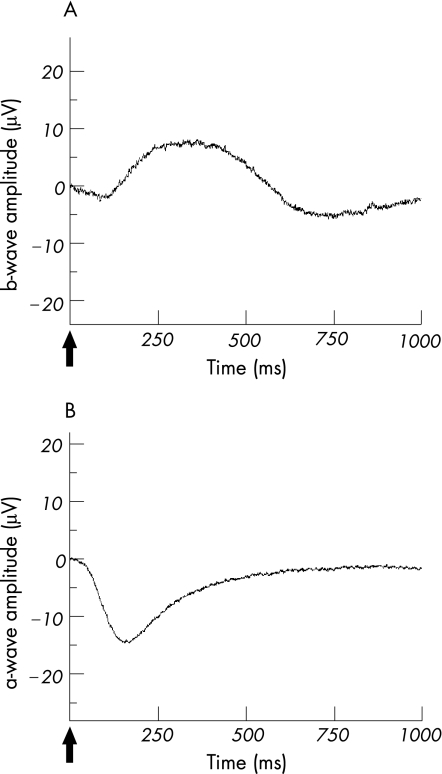
Figure 1 The ERG from the isolated perfused bovine retina. (A) The b‐wave is dominant in the ERG of the isolated perfused bovine retina under scotopic light conditions. It results from a 10 μs of light stimulus at a light intensity of 6.3 Mlx. (B) The a‐wave is dominant in the ERG of the isolated perfused bovine retina after blocking the b‐wave by 1 mM aspartate to the nutrient solution. The a‐wave was generated by using a 10 μs light stimulus of 6.3 Mlx at scotopic lighting conditions.

An official website of the United States government
Here's how you know
Official websites use .gov
A
.gov website belongs to an official
government organization in the United States.
Secure .gov websites use HTTPS
A lock (
) or https:// means you've safely
connected to the .gov website. Share sensitive
information only on official, secure websites.
