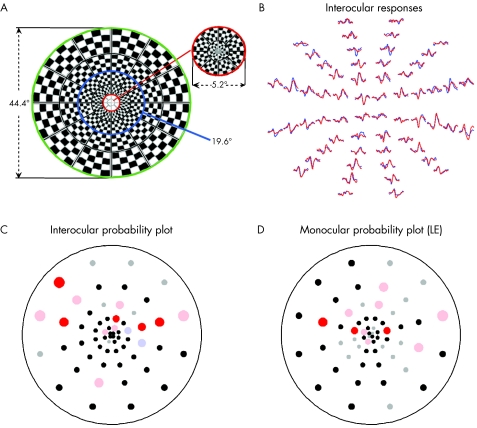
Figure 1 (A) The mfVEP stimulus display of 60 cortically scaled sectors. Each of the 60 sectors of the display is an independent pattern reversing checkerboard. (B) Sample responses for a patient with glaucoma for monocular stimulation of the left (red) and right (blue) eyes. (C) Latency probability plots for the interocular analysis of the responses in (B). (D) Latency probability plots for the monocular analysis of the responses from the left eye in (B).

An official website of the United States government
Here's how you know
Official websites use .gov
A
.gov website belongs to an official
government organization in the United States.
Secure .gov websites use HTTPS
A lock (
) or https:// means you've safely
connected to the .gov website. Share sensitive
information only on official, secure websites.
