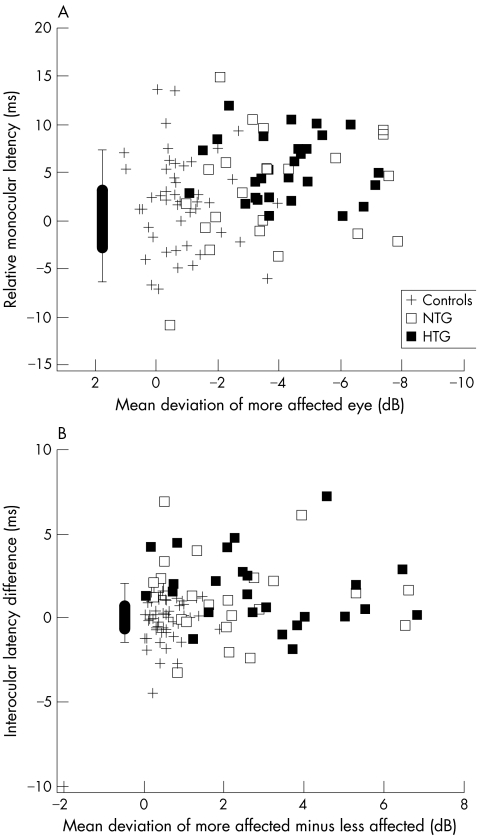
Figure 3 (A) Average relative monocular latency of the more affected eye (poorer MD) as a function of the mean deviation of that eye is shown for individual eyes (symbols) of the control (+), NTG (open square), and HTG (solid square) groups. The box plot shows the 25%/75% range (box), the 5%/95% range (vertical line) and the mean of the normative group (horizontal bar). Its placement along the x axis is arbitrary. (B) As in (A) for the average interocular latency difference.

An official website of the United States government
Here's how you know
Official websites use .gov
A
.gov website belongs to an official
government organization in the United States.
Secure .gov websites use HTTPS
A lock (
) or https:// means you've safely
connected to the .gov website. Share sensitive
information only on official, secure websites.
