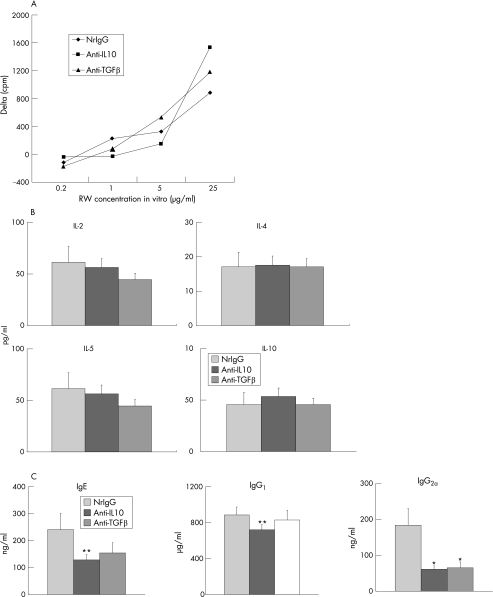
Figure 1 Effects of antibody treatment during the induction phase on systemic immune responses. Spleens and blood were collected to evaluate ragweed (RW)‐induced proliferation (A) and cytokine production (B) of splenocytes and total Ig levels in serum (C), respectively. (A) Data are expressed as Δ cpm. Background cpm ± SEM were: 1163 ± 22 in normal rat immunoglobulin G (nrIgG)‐treated (control) group; 985 ± 49 in the anti‐IL10 antibody‐treated group; and 1102 ± 22 in the anti‐TGF β antibody‐treated group. (B) Data are expressed as pg/ml. (C) Data are expressed as ng/ml or μg/ml. *p<0.01, **p<0.05, compared with nrIgG‐treated group.

An official website of the United States government
Here's how you know
Official websites use .gov
A
.gov website belongs to an official
government organization in the United States.
Secure .gov websites use HTTPS
A lock (
) or https:// means you've safely
connected to the .gov website. Share sensitive
information only on official, secure websites.
