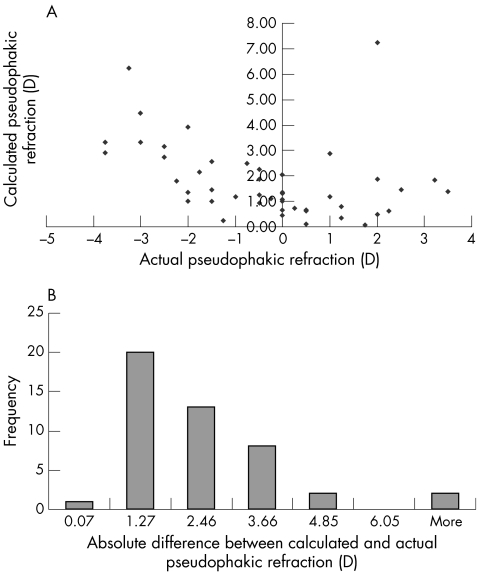
Figure 2 (A) Actual pseudophakic refractions plotted against calculated pseudophakic refractions; the two values were not similar by the Tukey test. (B) The absolute values of the differences between the actual pseudophakic refraction and the calculated pseudophakic refraction. As a group, there tended to be more difference from the actual pseudophakic refraction for the calculated values than for the estimated values (fig 3). “More” refers to the values 6.22 and 7.24 D.

An official website of the United States government
Here's how you know
Official websites use .gov
A
.gov website belongs to an official
government organization in the United States.
Secure .gov websites use HTTPS
A lock (
) or https:// means you've safely
connected to the .gov website. Share sensitive
information only on official, secure websites.
