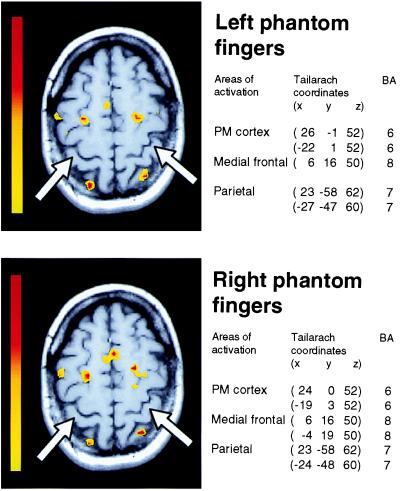
Figure 3.
Cortical activation areas during self-paced movements of phantom fingers. Two representative sections through the sensorimotor cortical hand areas during fingers-to-thumb opposition with the left (Top) and right (Bottom) phantom fingers. Arrows indicate the anatomical region corresponding to the hand representation in normal subjects (21). The color scale on the left of each section represents Student's t test values [yellow, t = 3.6 (P ≤ 0.001); red, t = 6.9). The anatomical locations of activated areas are listed next to the corresponding sections both as Talairach and Tournoux coordinates and probable Brodmann areas (BA).

