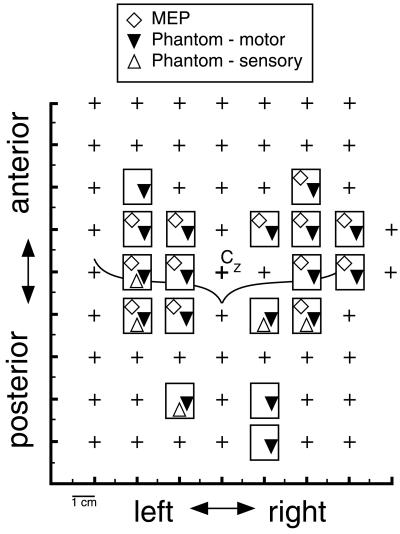
Figure 5.
Overlay of MEP map and the subject's reports of phantom hand sensations in response to TMS. Each rectangle represents a stimulation site from which positive responses were obtained. Crosses indicate stimulation sites with neither MEPs nor phantom sensations. The curved line depicts the approximate location of the central sulci.

